|
[Requires Professional or Enterprise Edition] WebLog Expert allows you not only to change properties of existing report items (e.g. number of rows in tables), but also to create your own tables and charts. Most predefined tables and charts can be also modified. Tables and charts can be managed in Options > Report > Tables. The Table Properties dialog contains the following pages: General
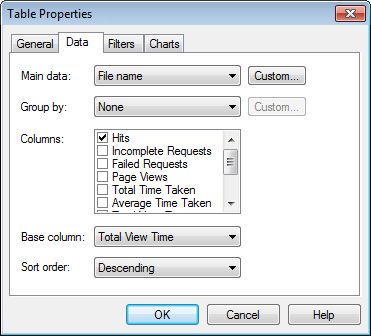
Data
Basic settings You can specify main data, group data (if any), columns, base column and sort order used in the table. Main data and group data contain data based on hits (e.g. file name or status code) as well as data based on visitors (e.g. visitor referring URL). You can use both main/group data based on hits or visitors as well as specify main data based on hits with group data based on visitors and vice versa. E.g. if you specify file name as main data and directory as group data, the program will show files grouped by directories. If you specify file name as main data and referring URL as group data, the program will show information on files requested by visitors that came from different referring URLs. If you specify referring URL as main data and file name as group data, the program will show information on referrers of visitors who requested different files. You can choose various columns. The conversion column includes number of visitors that reached any goal. If a table has the "Goals" type, the conversion column includes number of visitors that reached the tracked goal only. Data from the base column is used to sort the table and is also shown in the associated charts. Additional settings You can also specify additional data settings by clicking the Custom button. Available options depend on data chosen. ·Modification rules allow you to specify how to modify values before showing them in the report. ·Count one hit value per visitor - if several different values have been extracted from visitor requests only one of them will be counted in the number of visitors. E.g. even if a visitor used multiple browsers only one of them will be counted. This option doesn't affect other columns (hits/page views/bandwidth/etc.) shown in the table. ·Always show totals for visitors - show totals for the visitors column even if the same visitor may be counted in several rows (e.g. if he/she used multiple browsers). In this case total number of visitors shown in the table may be more than total number of visitors shown in the report general statistics. ·Grouped tables with the goal main data have the Show grouped data in N columns option available. Goals are shown in columns instead of rows if the setting is enabled. Filters
Filters allow you to specify which information should be shown in the table. You can use hit and visitor filters at the same time. In this case WebLog Expert first filters visitors and gets visitor data from the remaining visitors. Then it applies hit filters to the hits of these visitors and gets hit data from the hits. Charts
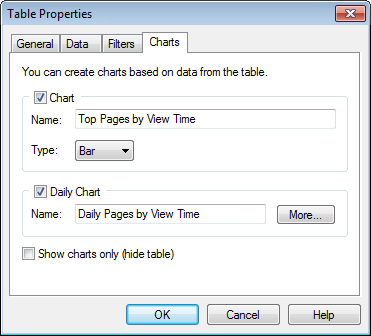
You can create charts associated with the table if no group data is specified. Chart names can include the %TableName% macro. Click the More button to enter names of weekly/monthly/yearly charts that are used when the Create weekly/monthly/yearly charts instead of daily ones profile property is enabled.
| |||||||||||||||||